Student Grades Prediction
A multiple regression model is used to predict
student grades in Mathematics and Portuguese.
What I did
- Data Wrangling
- Data Exploration
- Data Visualization
- Statistical Analysis
Deliverables
- Poster Presentation
Tools
- R Studio
Project Type
- Individual
Duration
- January 2020 - April 2020
Impact
- Predicted an 80% accurate learning model for student grades
Abstract
Providing an environment to foster student performance in classes is essential for their development. The rise in machine learning applications in various fields can benefit from improving the quality of their service. For example, in the academic industry, these applications would be helpful to obtain a 360-degree assessment of student performance. Thus, providing data to plan any educational interventions to improve student performance . To do this, I have used the student performance data set sourced by Paulo Cortez, University of Minho, GuimarÃes, Portugal. It is student performance in secondary education of two Portuguese schools in Mathematics and Portuguese subject (first, second and final grade). My exploratory analysis will be useful to identify various factors that influence student performance. My hope is this analysis will provide findings on which components are influencers in maximizing students' performance.
Research Question
- What are the attributes that impact strongly on student’s grades?
- Is there any correlation between first-period grade, second-period grade, with final grade (Mathematics and Portuguese)?
- Is there any correlation between school 1 Gabriel Pereira (GP) and school 2 Mousinho da Silveira (MS) in the final grades?
Goals
Use these correlations and construct a model that can predict the final grade of the student
Presentation

Research Process

Data Exploration
My question is an exploratory one: which data field correlates with student final grades. So, I considered to explore the data for other variables such as study time and health status, absences etc. First I look at the structure of the data set.

The data looks tidy with 33 variables it contains no missing values and NA's. So, I look at the descriptive statistics - (min, 1st Q, Median, Mean, 3rd Q, max). Then I created a subsetting the data into the student environment, student habits, and rename the columns.

Preliminary Analysis
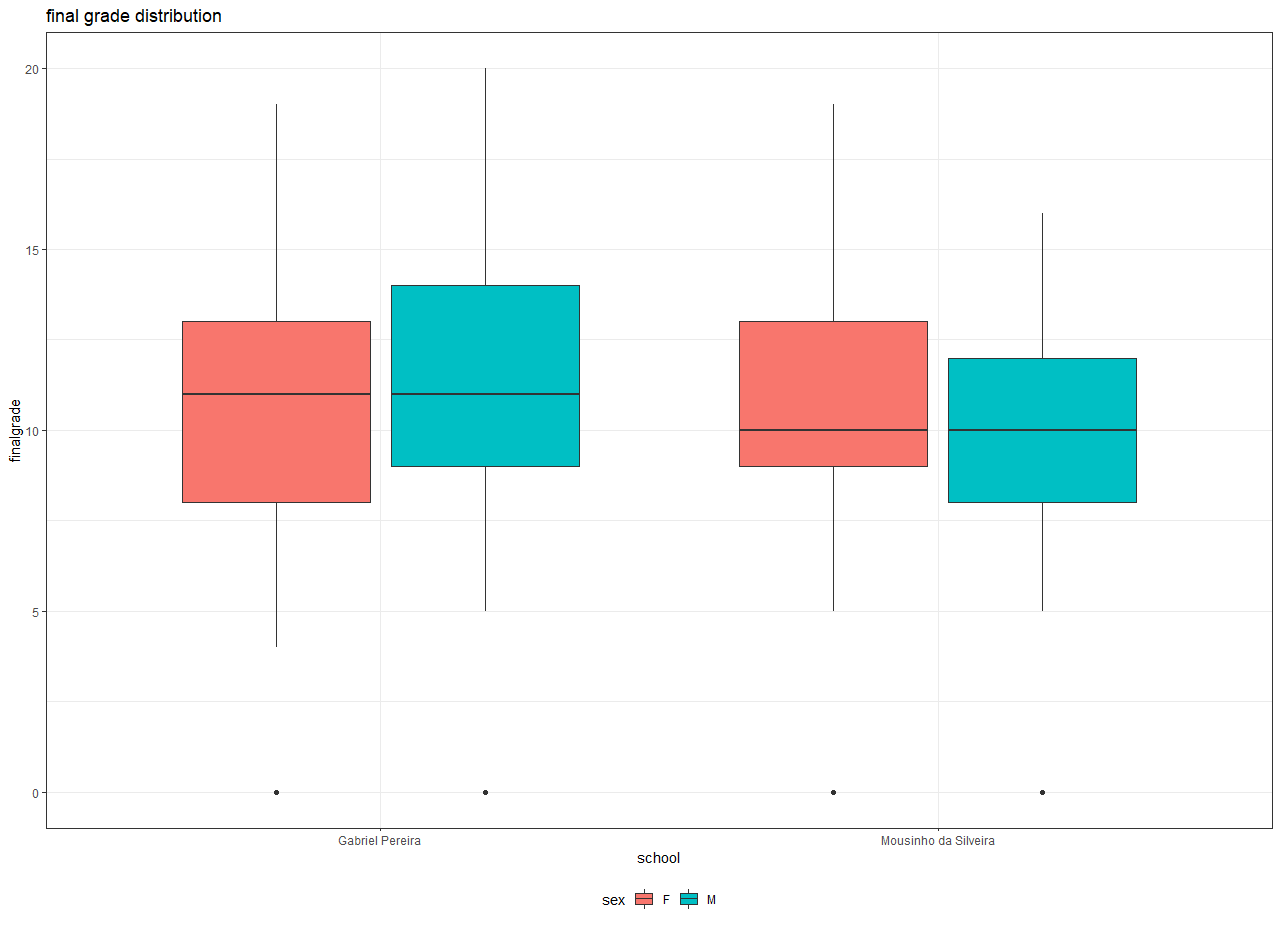
The first question I seek to validate is to find if there is any gender dependency on the final grades of the students. As illustrated in Figure 1, the mean final grade of male students (10.5 in blue box plot) is slightly higher than the mean final grade of female students (10.0 in orange box plot) across both the schools. Also, the third quartile (top 25%) of male students is shifted by 1-grade unit, when compared to that of the third quartile of female students. So, I hypothesized the mean of male students' grades is higher due to more number of male students in both the schools. So, comparing the grades between male and female students is a faulty comparison.


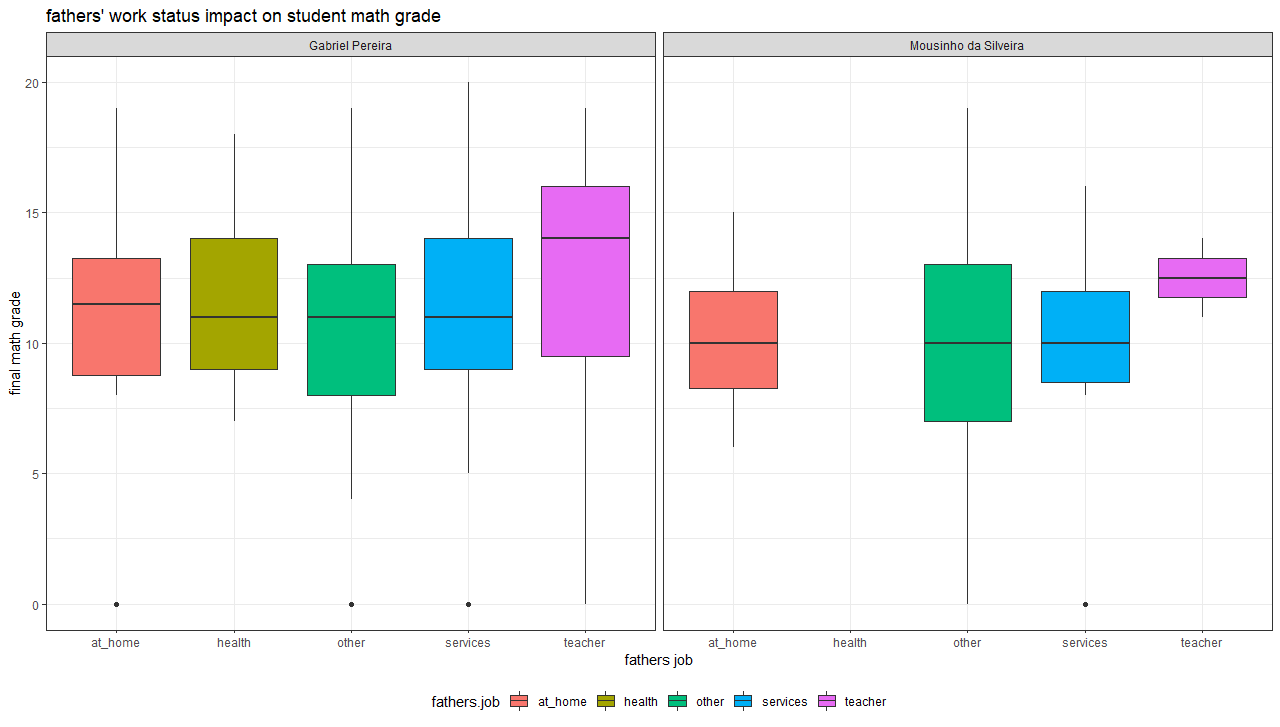
My second question to evaluate the correlation between various student attributes and the final grades. Among all the 30 attributes (features), I find that the fathers' job status has a stronger co-relation to the final grades; along with mothers' job and internet at home variables. The plot for math grades is in Figure 2. Students whose father is a teacher (represented as pink box plot) tend to get good grades (on average) as compared to other professions across both the schools (Gabriel Pereira and Mousinho da Silveira). Based on this data, I hypothesize that the student environment influences student grades. To elaborate, supportive parents (working as teachers) provide facilities and encourage their children to study at home. These factors may influence to good student grades.


I seek to validate is if the regular classroom assignment grades have any correlation to the final grades. Such a study/model is used to predict the student grade based on their in-class performance. As shown in Figure 3, there is a strong correlation between the in-class grades and the final grades. The trend is consistent across the schools, and for both the subjects. To conclude, students with better grades in their regular class assignments are likely to have better final grades (with few exceptions) . Such a model can be used by the schools to predict and improve student performance for the subsequent academic years.


Train the Model
Based on the initial exploration, mothers' job, fathers' job, internet at home, first and second-period grades have a positive correlation on the student's final grade. So, I trained the model using data of school 1(GP), tested on school 2(MS) for Mathematics and Portuguese subjects. Since the data contains continuous values, I used a multiple regression model to train the dataset; with multiple dependent variables influencing the independent variables.

Model Measure
To measure the goodness of the school 1 (GP) trained model. I used an R-squared measure to identify how close the data is near to 1. That means model with high R squared square contain more data points near to the regression line. For this model, the R-squared value is 0.82 or 82% . So, I used this model to predict students' grades of school 2(MS).

Prediction
I used the trained model for Mathematics of school 1 (GP) and tested on school 2(MS) and measured the accuracy of the test model using R-square. The accuracy of the predicted model is 0.83 or 83% and is increased by 1% compared with train model accuracy.

Plot the Experiment
There is a saying, “The greatest value of a picture is when it forces us to notice what we never expected to see.” – John Tukey. I visualized the data to compare the actual school 1 (GP) data with predict school 1 (GP) data for Mathematics and Portuguese. Similarly, I compared the actual grades of school 2 (MS) with a predicted grade of school 2 (MS) for Mathematics and Portuguese. The model follows Y=X line with predicted data points around it and with outliers. In the plots, I observed that students with actual grade zero scores above 0 in the predicted model. It is an error that affects model accuracy.


Limitations
- Improve accuracyIn the above plots, there are a few outliers around actual grade zero; I want to debug those and improve accuracy.

